AAPOD2 Image Archives
Centaurus A: Extreme Deep Field - 321 Hours
This ultra-deep, high-resolution image of Centaurus A (NGC 5128) was created using data collected over ten years, from 2013 to 2024, with my homebuilt telescope. There are no stars in this image — every single point of light is either part of the Centaurus A system or a distant background galaxy or quasar!
This work is a continuation of my Centaurus A "Extreme Deep Field" project, now with a larger field of view (FOV) and significantly more data — 321 hours in total, including 126 hours of narrowband H-Alpha and OIII.
In 2013 I gathered 120 hours of data on Centaurus A and processed the then deepest image ever obtained of this magnificent galaxy, showing several structures not revealed by amateurs before. I updated and re-processed the image in 2014 and 2018, including adding H-Alpha data to highlight the impressive emission structures triggered by the relativistic jet from the supermassive central black hole. This current image is a major update, now just over 10 years after my initial ultra-deep image was completed.
Several unique features are visible:
The full extent of H-Alpha and OIII filaments associated with the relativistic black hole jets:
The inner and outer Northern (bottom) jet shows many faint details not previously imaged
The Southern (top) jet is visible as a small red blob in the 10 o'clock position (first detected optically in my earlier 2013 image)
The complete shell structure of the halo, showing both the faint outer shells and brighter inner ones
A distinct blue arc, a remnant stellar stream from a dwarf galaxy absorbed by Centaurus A
1108 of the known globular clusters orbiting the galaxy
Countless distant background galaxies and quasars
Fun with spectroscopy
Image Details:
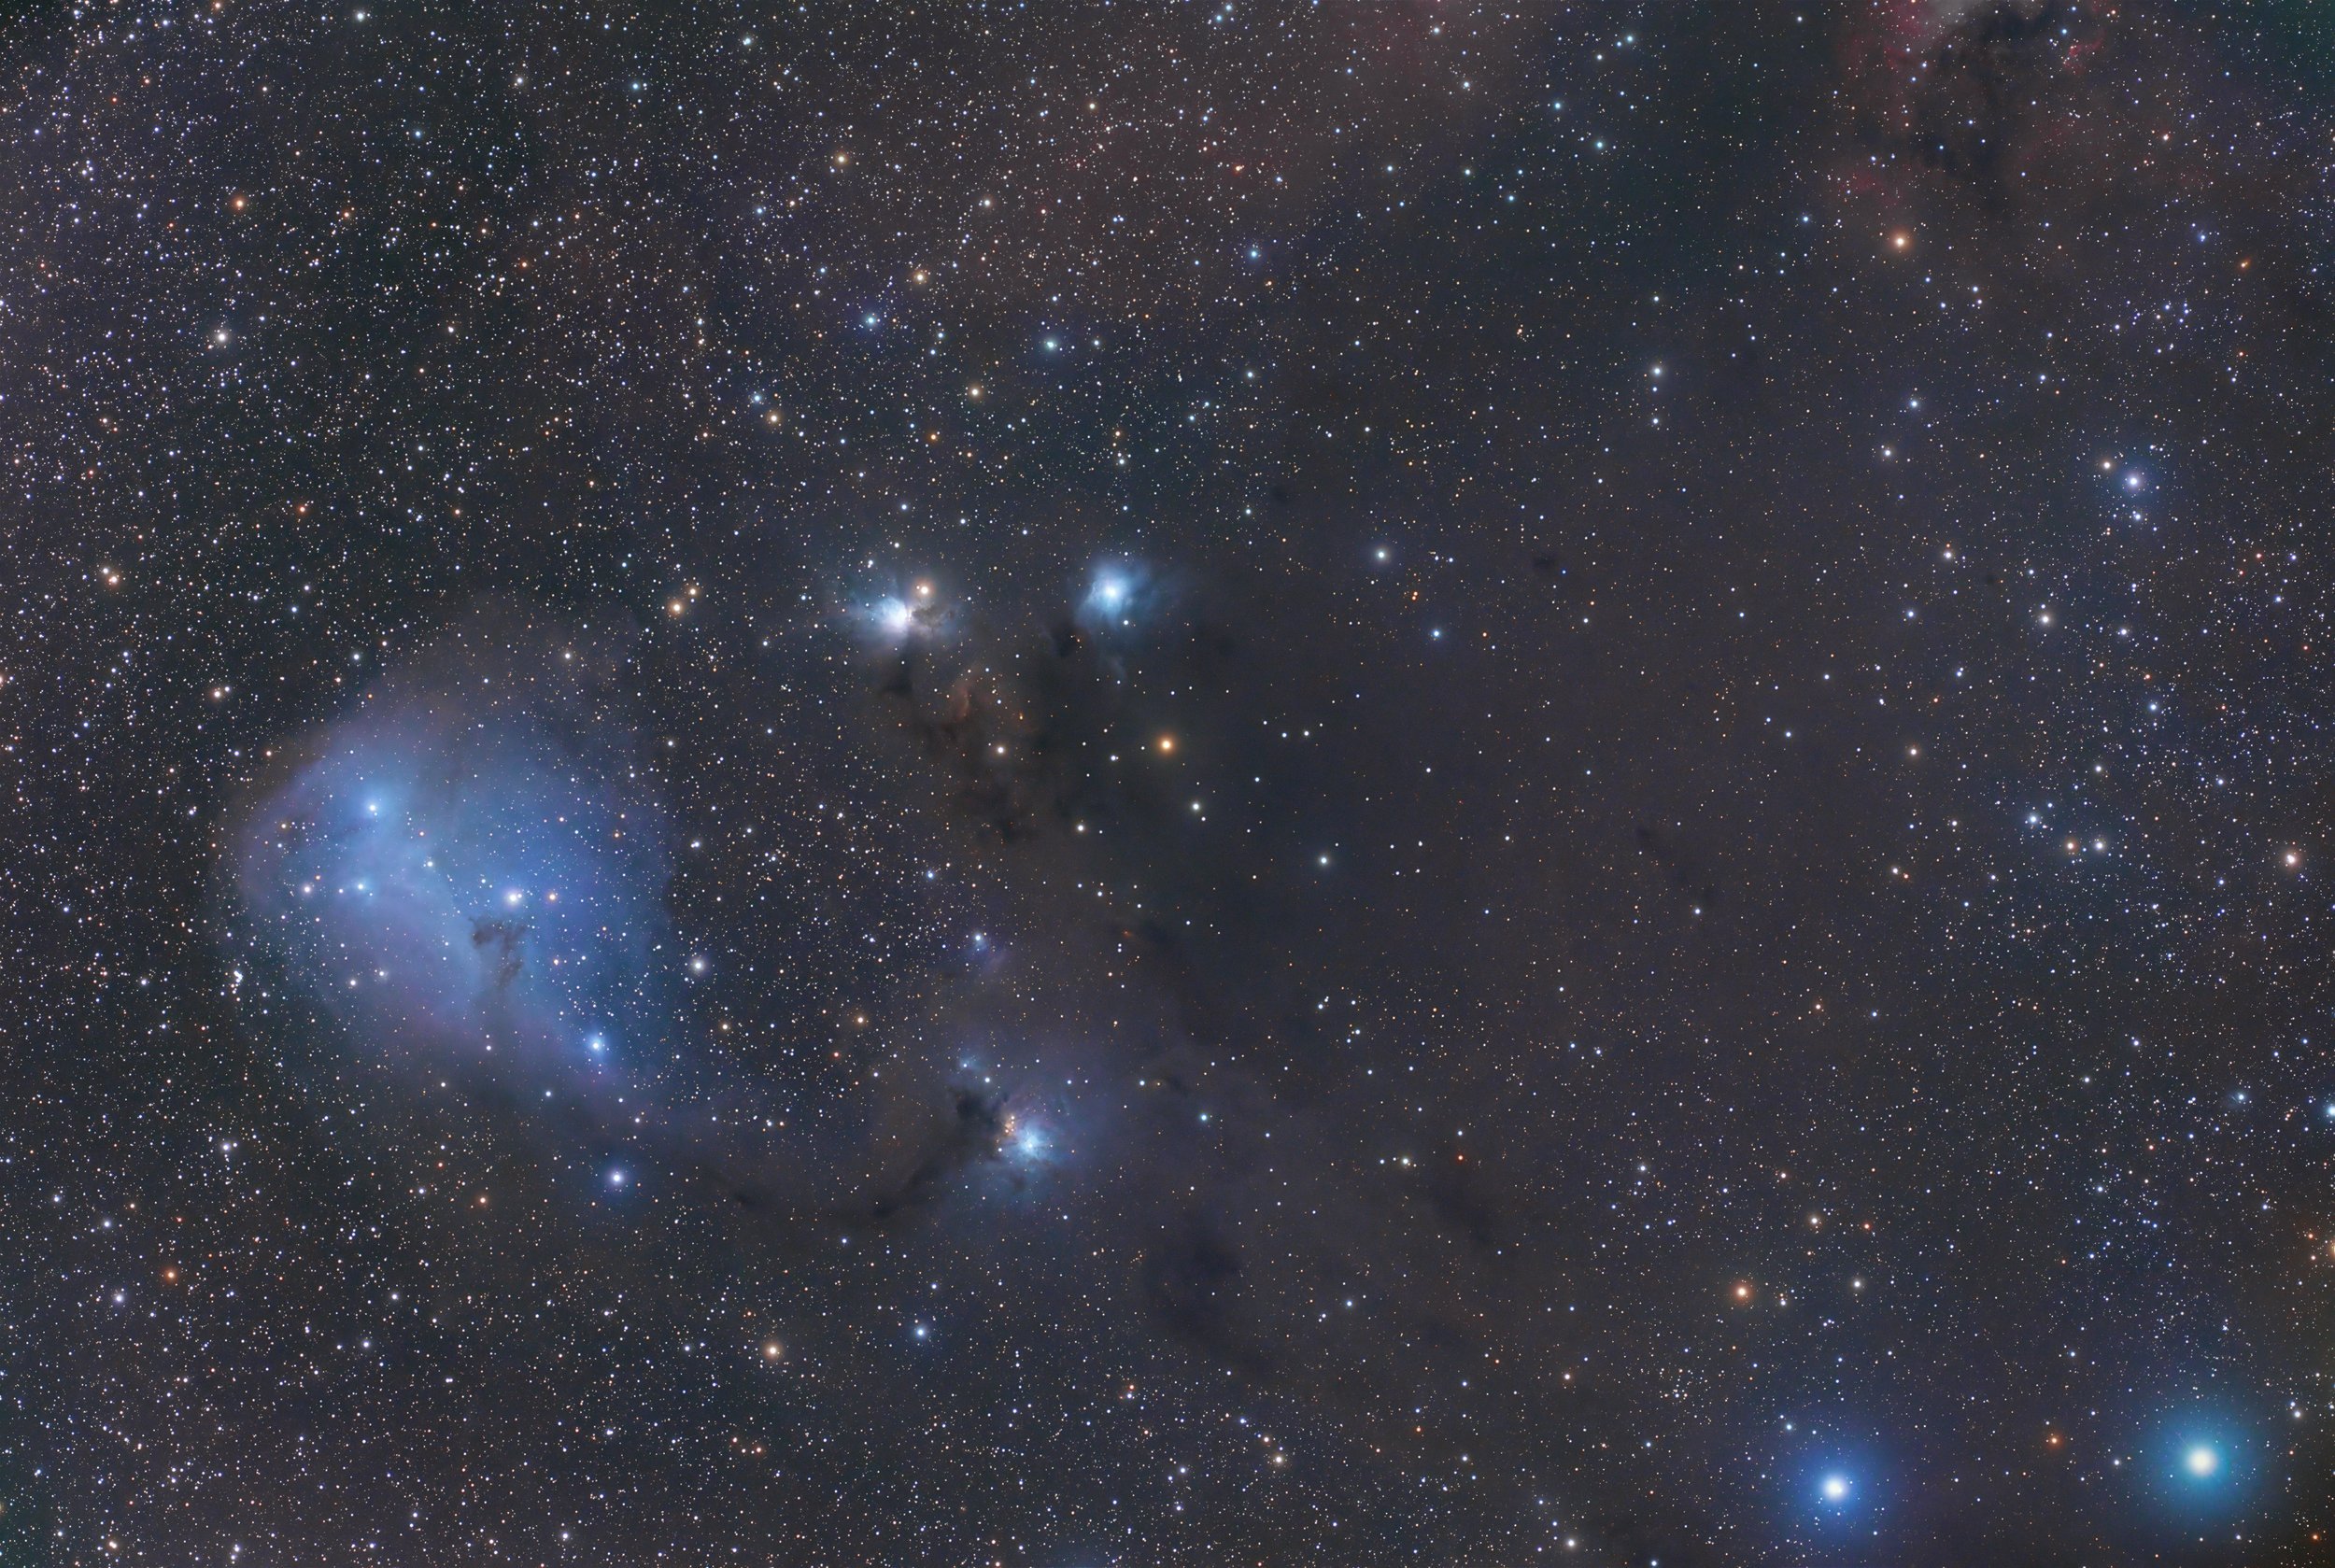
This image is a comparison of a range of spectra taken of 31 naked eye stars visible from the Southern hemisphere. Spectra were taken with a StarAnalyzer diffraction grating mounted in the filter wheel of my CCD camera on a 12.5" Newtonian telescope. Each spectrum was processed using RSpec software and calibrated for instrument response. The resulting spectra show the black body radiation profile of the various stellar types and their typical spectral line features.The star spectra are ordered according to stellar type, with hot blue stars at the top and cooler red stars towards the bottom. Hot blue stars (O, B, A types) have a light profile heavily skewed towards the left (blue and violet) end of the spectrum given these stars emit the majority of their energy at short wavelengths. They also display the famous Hydrogen Balmer series of absorption lines.In the centre are the F, G and K type stars with their more even light profiles and numerous but fainter absorption lines.Towards the bottom are the cooler M type stars with profiles heavily skewed towards the red and infrared end of the spectrum. They show many broad absorption lines from Titanium Oxide molecules suspended in their atmospheres.At the very bottom are two examples of Wolf-Rayet stars that have unusual spectra with some prominent emission lines.Also visible are a couple of absorption lines in the red, which appear in every single spectrum regardless of spectral type. These are caused by terrestrial oxygen in the Earth's atmosphere.The background image is my deep photo of cometary globules CG 30, CG 31 and CG 38 in Puppis.Date: 29 May, 1 June 2021Exposure: Luminance 0.03s - 3s @ -25CTelescope: Homebuilt 12.5" f/4 Serrurier Truss NewtonianCamera: QSI 683wsg with Lodestar guiderFilters: StarAnalyzer 200 Diffraction GratingTaken from my observatory in Auckland, New Zealand See Less
Copyright: Rolf Olsen


